GUEST BLOGGER
Encik G
20 Nov 2015

Melbourne/Victoria has net influx migration and is on a path to surpass Sydney as the most populous State. Of course people are unhappy; there is a time lag and strain on essential services before they catch up with the population growth. House prices are set to increase; trams are packed and make the headlines of constantly breaking down.
In South Australia, with the loss of car manufacturing jobs, it is one State this is currently registering the highest unemployment rate with its economy hinging on research and education and the awarding of contracts to build subs and ships in Adelaide.
In the NT, it is the only state with negative net migration but remains one of the lowest in terms of unemployment, second only to the ACT or Canberra.
Which do you prefer? Sub-zero winters or the tropical North? Or perhaps you prefer to compete with 66-68 thousand new migrants to the State for a job?
MIGRATION SUMMARY, State & territory - 2013-14(a)
| |||
 |
Net Overseas Migration (NOM)
|
Net Interstate Migration (NIM)
|
Net migration
|
| | | |
State or territory
|
no.
|
no.
|
no.
|
NSW
|
73 300
|
-6 857
|
66 443
|
Vic.
|
59 358
|
8 783
|
68 141
|
Qld
|
30 270
|
5 753
|
36 023
|
SA
|
11 166
|
-2 968
|
8 198
|
WA
|
32 270
|
1 045
|
33 315
|
Tas.
|
1 322
|
-1 168
|
154
|
NT
|
2 983
|
-3 344
|
-361
|
ACT
|
2 017
|
-1 244
|
773
|
Australia(b)
|
212 695
|
-
|
212 695
|
(a) Estimates are preliminary - see paragraph 9 of the Explanatory Notes.
(b) Includes Other Territories. | |||
| |||
Unemployment Rates by Labour Force Region, July 2015 (%)
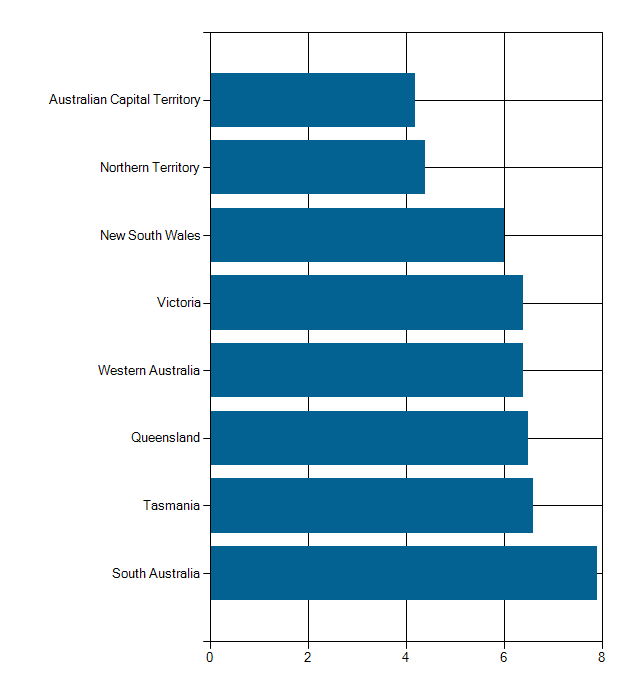
Chart Source: ABS Labour Force Survey, three month average original data
And because in Darwin you have BFFs who hang out with you everyday to hold your KKB
ReplyDelete